Projects
Projects
Final Project: March Madness Simulation
For our final Computing II project, my team created a March Madness prediction dashboard using Java, Vaadin, SMILE machine learning, and Monte Carlo simulation. The goal of the project was to predict tournament matchups, compare team statistics, and simulate a full tournament bracket.
Team Members
- Cade Yates
- Matthew Hightower
- Isaac Ojeda - https://isaac-ojeda.quarto.pub/isaac-ojeda/
Project Summary
Our system used college basketball data to compare teams and predict possible winners. We used historical March Madness data along with current tournament team statistics. The machine learning model used these stats to estimate win probabilities, and the Monte Carlo simulation ran the tournament multiple times to see which teams had the best chance to win.
The Vaadin website included three main tabs:
Team Stats
Matchup Analysis
Visual Simulation
This project connects to Industrial Engineering because it uses data, probability, simulation, and decision-making to analyze outcomes. Instead of just guessing tournament winners, our project used data and modeling to make more informed predictions.
Skills Used
Java object-oriented programming
Custom Java classes
ArrayLists and file input/output
CSV data processing
Vaadin user interface design
SMILE machine learning library
Monte Carlo simulation
GitHub collaboration
Project Development Process
Our original goal was to create a simple March Madness prediction tool that could compare teams and predict winners. As we worked on the project, it became more advanced because we added a visual bracket, matchup predictions, team statistics, and a full tournament simulation.
One challenge was combining multiple data files and making sure everything matched correctly. We had to work with tournament data, historical data, and cleaned datasets so the model could compare teams accurately.
Another challenge was connecting the machine learning model to the Vaadin interface. We wanted users to be able to select teams, view stats, predict matchups, and simulate a full tournament directly from the website.
In the end, the project turned from a basic idea into a more complete dashboard with interactive features.
Key Features
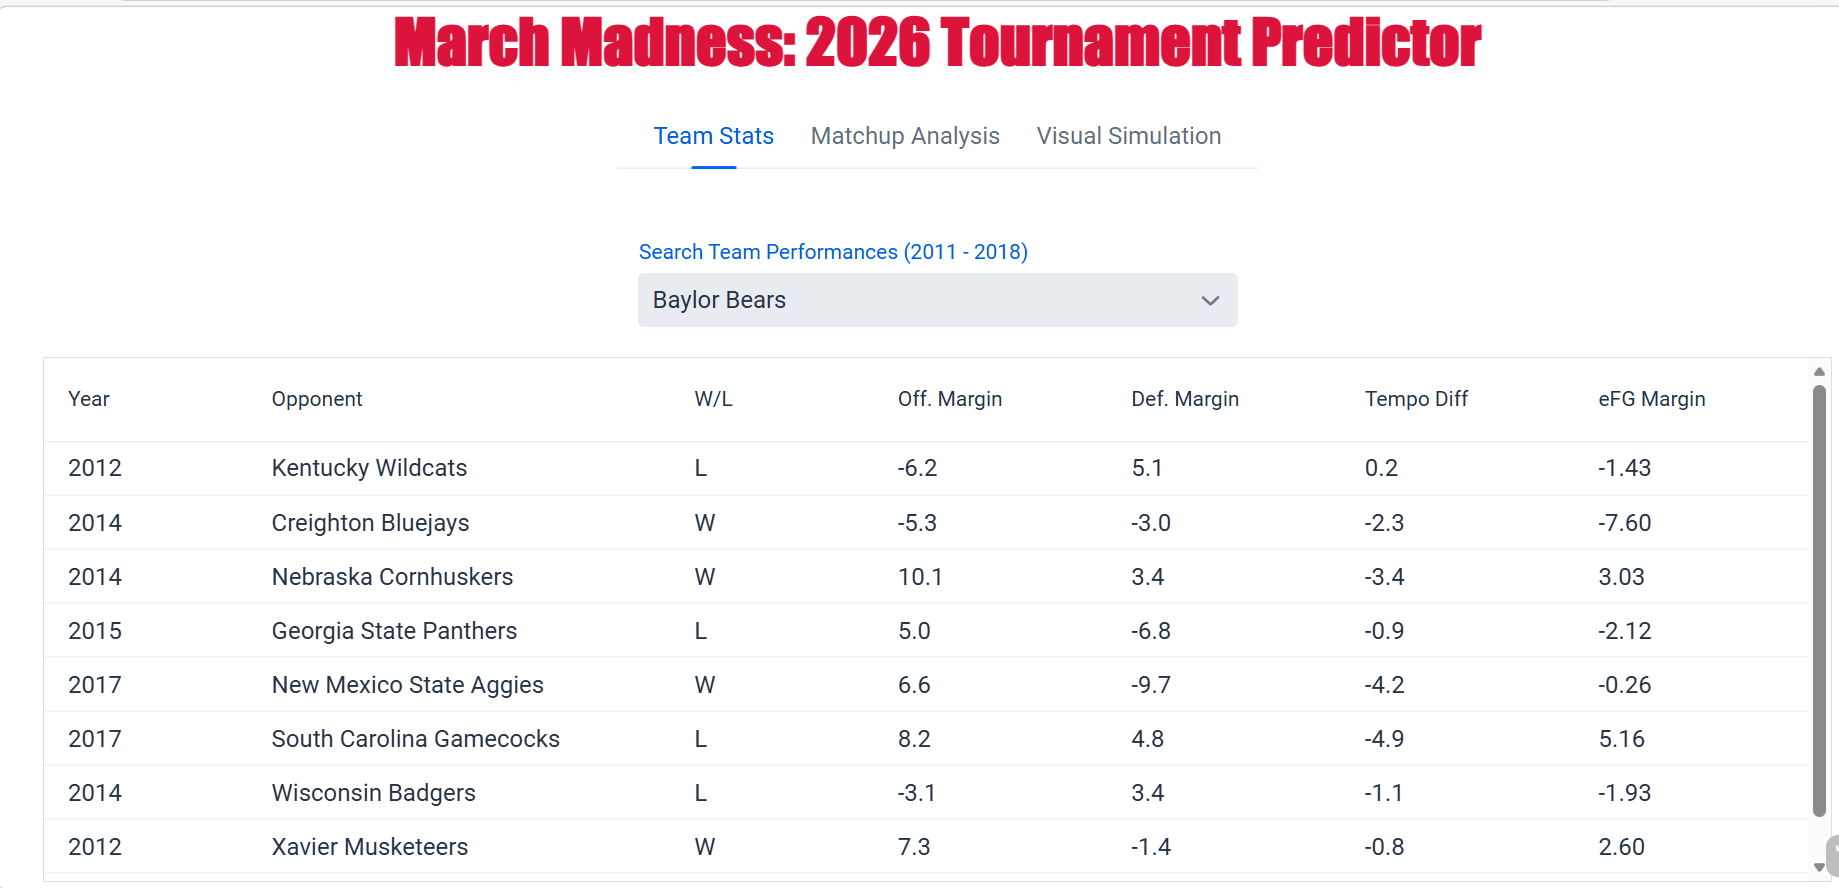
Team Stats Tab
The Team Stats tab allows the user to select a team and view performance data. This made it easier to understand the data instead of just looking at raw CSV files.
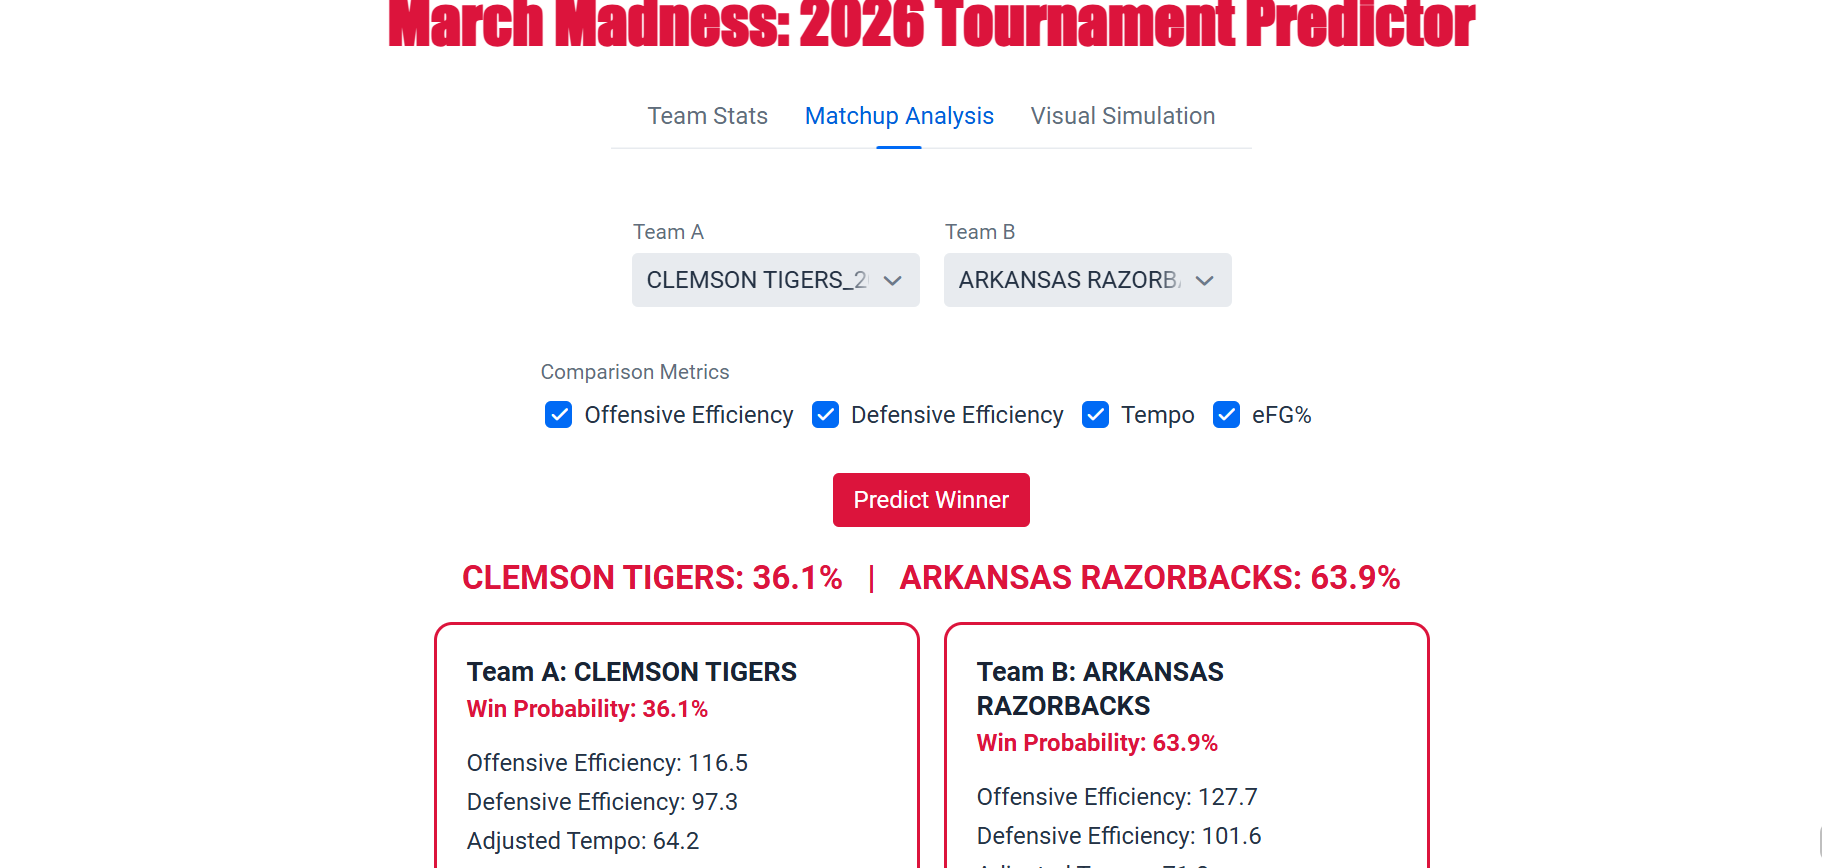
Matchup Analysis Tab
The Matchup Analysis tab lets the user select two teams and predict which team is more likely to win. It also includes comparison metrics so users can visually compare important stats.
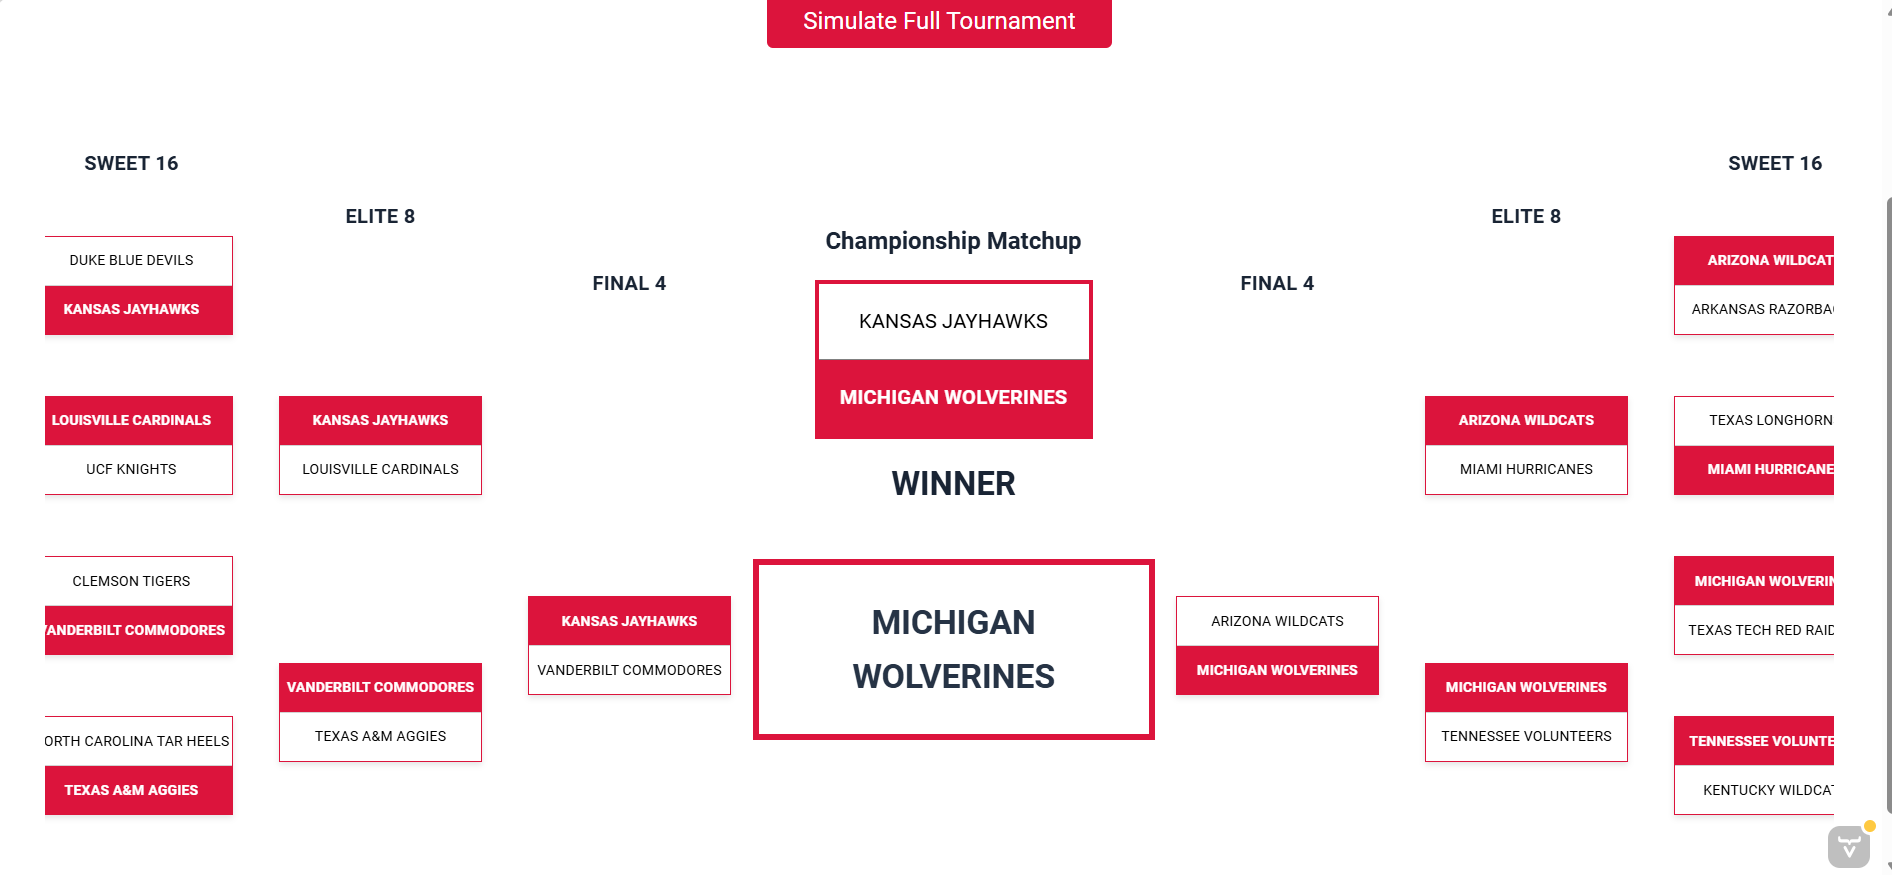
Visual Simulation Tab
The Visual Simulation tab runs a full tournament simulation. The program uses the trained model and Monte Carlo simulation to move teams through the bracket and estimate a tournament winner. It displays the tournament from the Sweet 16 all the way to the National Championship.
Machine Learning Model
The project used SMILE classification models, including Random Forest and Gradient Tree Boost. These models were trained on historical data and used to predict matchup win probabilities.
Monte Carlo Simulation
The Monte Carlo simulation repeatedly ran the tournament using win probabilities from the model. This gave a better idea of which teams had stronger chances to win the championship.
Reflection
This project helped me understand how object-oriented programming can be used in a larger application. I learned more about connecting data, machine learning, and a user interface together.
One part I am proud of is helping set up the Monte Carlo simulation. It was cool to see everything come together in the simulation tab. You can run the simulation multiple times, and it produces different outcomes each time, which shows how unpredictable the tournament can be.
I learned that teamwork is important when building a larger project. Different parts of the code had to work together, so communication and debugging were a big part of finishing the project. Overall, this project made me more confident with Java, Vaadin, debugging, and working with data in a real application.